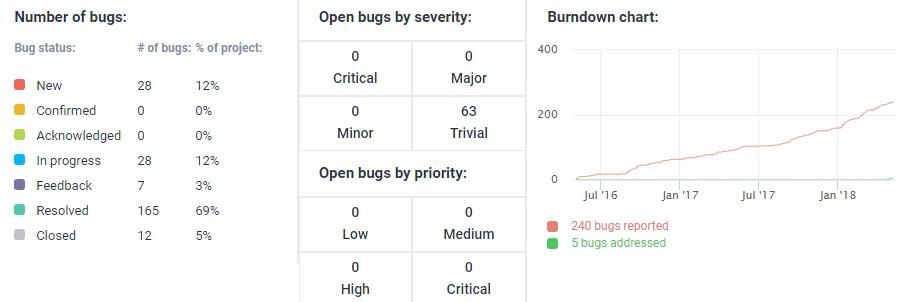
Burndown chart wrongly showing zero addressed bugs since april 2018
Somewhere around 17 april 2018, the burndown charts for all my projects seem to have been reset and started showing zero addressed bugs up until that point. That is, the green curve is crawling along the x-axis. The panel on the left side showing the number and percentages of bugs of different categories is still showing correct information.
Since the incident, the burndown charts are registering resolved bugs again, but only new ones, so that the green curve is just now leaving the floor, even though I may have a global resolved percentage over 50%.
I thought this may have been observed by others and would be fixed soon, but it hasn't so I thought I'd better report it.
I can see that there has been similar bug-reports before, but since they are all several years old, I conclude that what is going on in my instance is something new.

Сервис поддержки клиентов работает на платформе UserEcho
